How to measure the success of your shopping mall loyalty mobile app and improve its performance.
In the first part of our article, we explored essential metrics such as conversion rate, Net Promoter Score, Average Revenue Per User, and the importance of in-app feedback in measuring the success of your shopping mall loyalty mobile app.
As we move forward, we will now delve into the second part of our guide, where we will continue to unravel more strategies and insights to optimize the performance of your app. In this part, we will cover topics such as Beacon Technology, Optimizing user experience, Offering personalized rewards and offers, or Leveraging gamification. With these additional tips, you will gain valuable insights and practical steps to ensure your shopping mall loyalty mobile app is performing at its best, driving customer engagement and loyalty to new heights. So let's dive in and explore these another strategies in detail!
7. Beacon Technology Performance
Beacon technology is a powerful feature that can greatly enhance the performance of your shopping mall loyalty mobile app. Beacons are small wireless devices that use Bluetooth technology to send signals to nearby smartphones, allowing you to deliver location-based notifications, offers, and promotions to app users when they are in close proximity to your mall or specific stores within it. Beacon technology can greatly improve user engagement, drive foot traffic to your mall, and boost sales.
According to a study conducted by Swirl Networks, Inc., a leading provider of beacon marketing solutions, beacon-triggered messages can result in a significant increase in key performance metrics for retailers. The study found that on average, beacon-triggered messages resulted in a 73% increase in in-store visits, a 45% increase in app usage, and a 14% increase in purchase frequency.
This statistic highlights the effectiveness of beacon technology in driving user engagement and increasing app usage, which can ultimately lead to higher revenue for your shopping mall. By leveraging beacon technology in your loyalty mobile app, you can send personalized and timely notifications to app users when they are in close proximity to your mall, prompting them to visit, explore, and shop. This can result in increased foot traffic, higher conversion rates, and improved overall app performance.
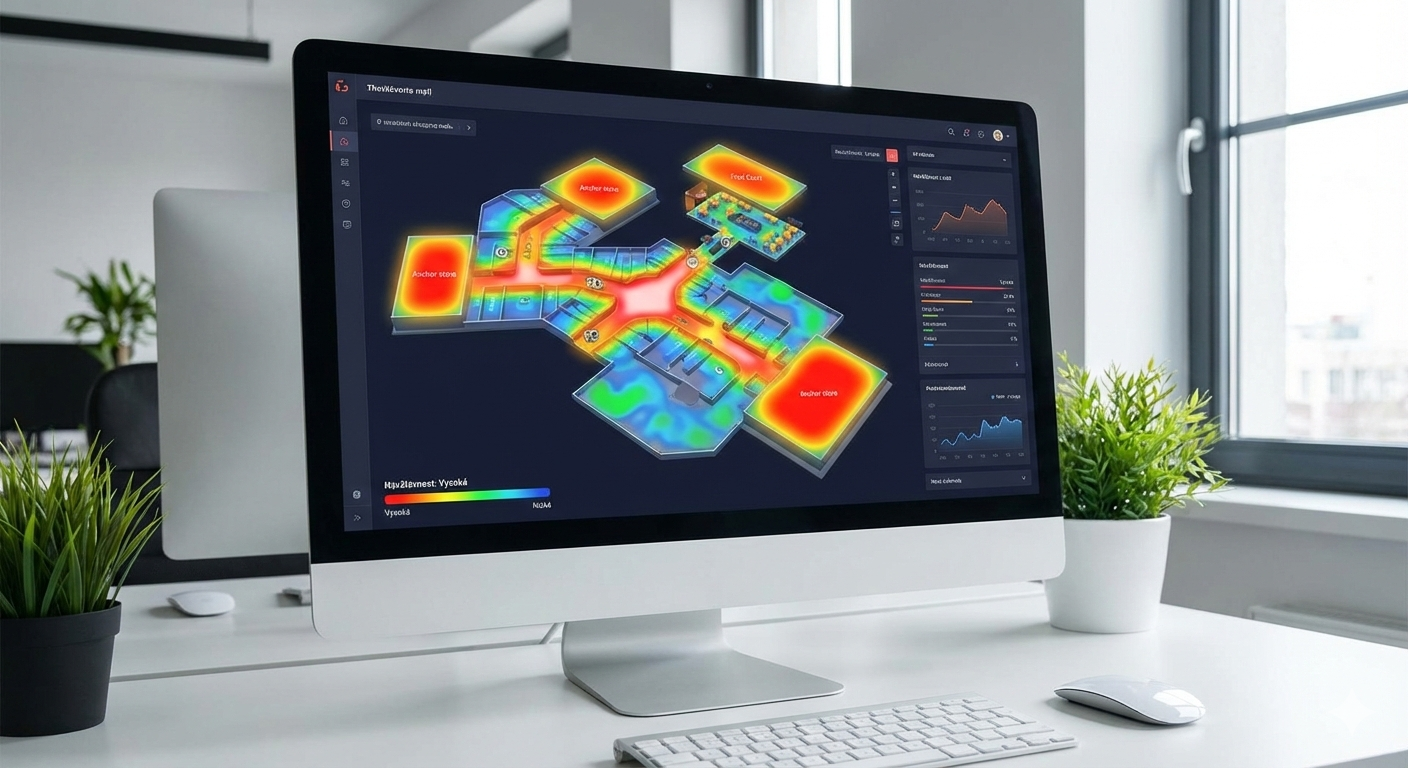
To maximize the performance of beacon technology in your app, it's important to strategically place beacons in key areas of your mall, such as entrances, exits, popular stores, and high-traffic areas. You can also segment your app users based on their preferences, purchase history, and location to deliver highly targeted and relevant notifications. Regularly monitoring and analyzing the performance of your beacon-triggered messages can provide insights into user behavior, preferences, and the effectiveness of your campaigns, allowing you to continuously optimize your app's performance and drive better results.
8. Analyze your data
One of the main steps in improving your app's performance is to analyze the data you collect. Make use of the analytics tools available to you to understand how users are interacting with your app.
Data-driven insights can provide valuable information about user behavior, preferences, and trends, which can inform your app strategies and help you make data-backed decisions. One key statistic to consider when analyzing your data is the conversion rate, which measures the percentage of app users who complete a desired action, such as making a purchase, signing up for a loyalty program, or engaging with a promotional offer.
According to a study by Criteo, the average global app conversion rate across industries is 2.7%, with variations depending on factors such as app category, user demographics, and market conditions. This statistic underscores the importance of understanding and optimizing the conversion rate of your app to drive desired user actions and achieve your app goals.
Analyzing your app data can provide insights into the effectiveness of your app features, user interface, offers, and promotional campaigns.
Here are some key data analysis strategies to consider:
Funnel Analysis:
Use funnel analysis to track the user journey in your app, from initial engagement to conversion. Identify potential bottlenecks or drop-off points in the user flow and analyze data to understand the reasons behind user abandonment. This can help you optimize your app flow, improve user experience, and drive higher conversion rates.
A/B Testing:
Implement A/B testing to compare the performance of different app features, offers, or promotional campaigns. Test different variations and analyze data to determine which version performs better in terms of conversion rate. Use A/B testing to iterate and optimize your app strategies for maximum user engagement and conversion.
User Segmentation:
Segment your app users based on various attributes, such as demographics, behavior, or loyalty status. Analyze data for different user segments to understand their preferences, engagement patterns, and conversion behavior. Use these insights to personalize your app experiences, offers, and promotions for different user segments to enhance conversion rates.
Cohort Analysis:
Conduct cohort analysis to track the performance of specific groups of users over time. Create cohorts based on user cohorts (e.g., users who joined in the same month) and analyze their engagement and conversion behavior. Cohort analysis can help you identify trends, patterns, and opportunities for improving conversion rates among different user cohorts.
Data Visualization:
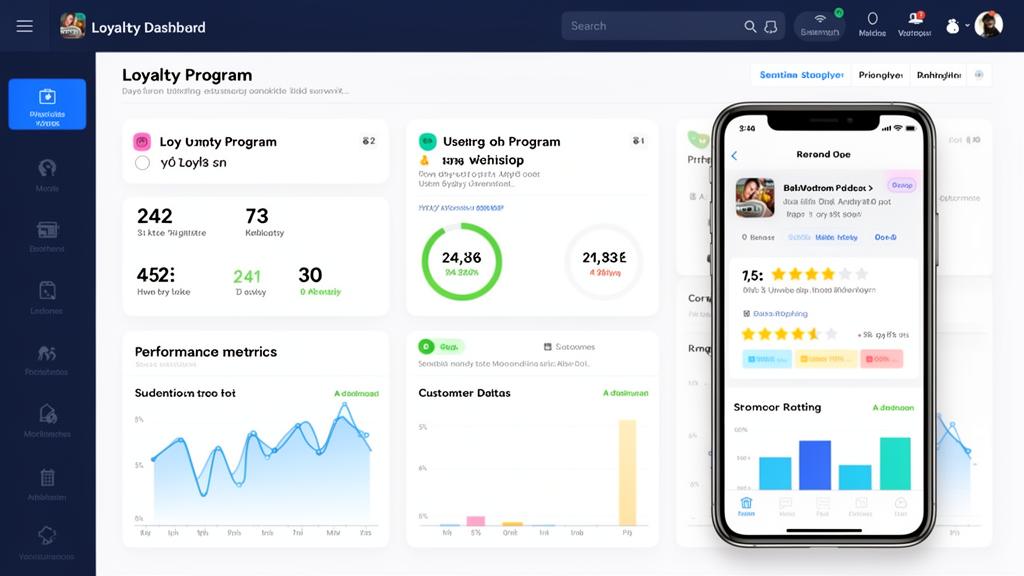
Use data visualization techniques, such as charts, graphs, and dashboards, to visually represent your app data and gain insights at a glance. Data visualization can help you identify patterns, trends, and outliers in your app performance, and facilitate data-driven decision-making.
By analyzing your app data, specifically focusing on the conversion rate, you can gain insights into the effectiveness of your app strategies, optimize your user experience, and drive higher user engagement and loyalty.
9. Additional KPIs Worth Tracking
Beyond conversion rate, NPS, ARPU, and in-app feedback, a few more Key Performance Indicators round out a complete picture of your loyalty program's health.
Customer Retention Rate
Retention is one of the clearest signals of a loyalty program's effectiveness. Research by Bain & Company shows that a modest 5% increase in customer retention can lift profits by 25% to 95%, underscoring how much is riding on repeat visits and continued patronage (Source: Bain & Company's "E-Loyalty: Your Secret Weapon on the Web," Harvard Business Review).
Customer Lifetime Value (CLV)
CLV estimates the total revenue a customer is expected to generate over their relationship with the mall. A rising CLV after launching or refining a loyalty program signals that you are building long-term, profitable relationships rather than one-off transactions.
Redemption Rate
How often customers actually redeem their rewards is a direct read on how appealing those rewards are. High redemption rates typically correlate with strong engagement and satisfaction, while low redemption suggests the rewards on offer aren't resonating (Source: Bond Brand Loyalty Report 2021).
Program Participation Rate
This tracks the share of customers actively enrolled and engaging with the program. A high participation rate is generally linked to higher satisfaction and revenue, and reports from organizations like Bond Brand Loyalty offer useful benchmarks for comparison.
Don't Skip the Cost-Benefit Analysis
Alongside these KPIs, run a regular cost-benefit analysis: weigh what it costs to run the program against the tangible gains — incremental sales, higher foot traffic, and improved retention. This is what ultimately confirms the loyalty program's ROI and financial sustainability for the mall.